
How I wrote an API connector in R to get info from Discogs
How I extracted the data in my last post

Warning: This is going to be quite a technical newsletter, so if that’s not your thing … well, I’m warning you up front!
OK, yes, this was a bit slow to send out …
In my last newsletter, I talked about a little side project of mine, where I used the programming language R to call the Discogs API and calculate an average value of each of my dj mixes based on a suggested price per record used:
What's my most valuable dj mix? An investigation using R and the Discogs API

Welcome back to Data Rampage, and sorry for the delay in sharing new newsletter - work heated up a lot and then I was on vacation for several weeks in beautiful Savannah, Georgia. Now that I’ve been back for a week I’m ready to share the results of a little side project I started working on during my trip; and yes, …
In this post, I’m going to walk you through exactly how I did this, and some of the challenges I faced when doing so.
If you want to follow along with the code, I’ve made it available in GitHub in two scripts:
discogs_functions_randallhelms_FINAL.R - These are the functions I wrote to use, you would need to load them into your R environment first
discogs_project_randallhelms_FINAL.R - This is the actual script that you would run, that takes you through the project; you would need to get your own personal access token from Discogs to run it, however
If you don’t have R installed, you would need to do these steps first:
Install RStudio as your IDE
Use this code snippet to install the necessary packages and follow along:
install.packages(c("tidyverse","googlesheets4","lubridate","snakecase","ggthemes","purrr","httr","glue","ggthemes"))That should get you set up!
Authentication
Discogs makes some API functions publicly available, meaning anyone can request information, while others require authentication, meaning that you have to register and get login credentials in order to access them.
As registration is free and authentication offer additional options over anonymous usage, I went to the developer settings and generated a personal access token to use for authentication.
To store my credentials, I made a simple function called discogs_pat which saves the token to my local R environment; this token is then retrieved in each of the functions and added to the API call where I request the relevant information.
A little note here about how to make an API call in R; let’s take requesting user information as an example. To do so, you need to make a GET call to a specific URL along with your authentication information - a GET call is one of the types of standard API calls, so to put it in layman’s terms you are telling your computer, ‘send a message to this URL and ask for information and present it with these credentials, just like you might present a passport at an airport.” Then the computer on the other side checks those credentials and returns the information you want.
In my case, I wanted to check my own user information (and you can see what the raw API response looks like at this link: https://api.discogs.com/users/hodderian), but I had a tremendous problem figuring out exactly how to present the authentication information, as this is not something that is standardized across all APIs. I tried using ChatGPT to solve this, but I gave up after four suggested solutions all failed to work; in the end I figured it out by looking at someone else’s code on Github.
All it required was to paste the token together with a bit of text:
result <- GET(get_url,add_headers(Authorization = glue("Discogs token={access_token}")))Get all the lists!
Having figured out authentication, my next step was to build a dataset of all of the records I’ve used on each mix, which required working with the list functions in a two step process:
Get all of my own lists
For each of my lists, get all of the records on each list
Getting a dataframe of my own lists was pretty tricky, because each API call returns only 50 results, and I’ve made close to 200 lists, meaning that I had to use pagination to make multiple calls and join the results together. In plain language, that means that I need to make the initial call, get the information about how many total results there were, and then make slightly modified calls to get the rest of the results by adding extra information to the URL, like this:
new_url <- paste(lists_url,'?page=',i,'&per_page=50',sep='')This just adds a page number to the URL with the i representing an incremental value that increases with each loop. In order to put all the results together into a single dataframe (a rectangular data structure, something like an Excel table or a database table but stored locally in the computer’s memory), I had to tell the computer to run on a loop until all results were returned, with each loop involving calling the API and then flattening the results into a single dataframe that could be added at the bottom of the previous results. A bit like data Lego!
Since the API results were nested (meaning that they were on different levels), I wrote a function called discogs_list_fixer that runs through every list object, tidying it up and flattening it into a single-row table and then stacking them up. Put it all together and it’s like Lego within Lego.
This is what that looks like:
if (lists$pagination$pages > 1) {
page_nr <- lists$pagination$pages
for (i in 2:page_nr) {
new_url <- paste(lists_url,'?page=',i,'&per_page=50',sep='')
temp_get <- GET(new_url,add_headers(Authorization = glue("Discogs token={access_token}")))
print(temp_get)
temp_lists <- content(temp_get,'parsed')
temp <- temp_lists$lists
temp_df <- discogs_list_fixer(temp)
list_df <- bind_rows(list_df,temp_df)
}
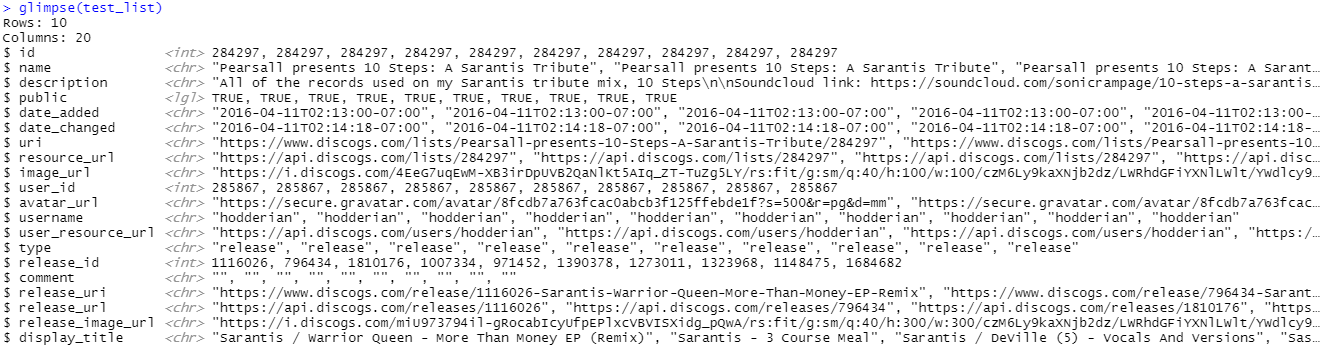
}The next step was to get all of the releases from each Discogs list, and to do so I wrote a function called discogs_list which would call the API and get the all of the records from each list, and I then wrapped that in a function called discogs_get_all_lists that took a vector of all of the individual list IDs and called discogs_list on all of them to build a data frame of all of the releases used.
Phew!
Here’s what a single example looks like:
Give me price suggestions
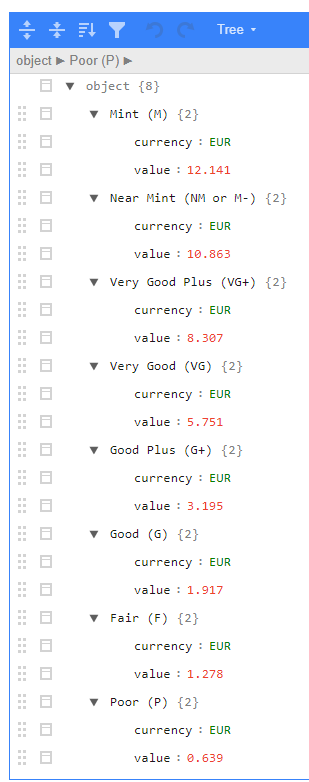
With a dataframe of all of my Discogs lists in my possession, it was now time to get the actual price suggestions from the API; calling this API function returns a JSON object with a price suggestion for each condition level in the currency associated with your account (in my case Euros).
In practice, the API output looks like this:
To make this easier to work with, I use the map function from the super useful purrr package to pull the currency and value fields into their own single column dataframes, then I horizontally join them to another dataframe that I’ve made from the release_id and the names of the different list fields (aka the condition). More data Lego! This is what the code looks like:
#create single columns from each list field, then bind them horizontally

    res3 <- map(result2,~.x[['value']])
    res4 <- try(do.call('bind_rows',map(res3,as_tibble)))

    curr <- map(result2,~.x[['currency']])
    curr2 <- try(do.call('bind_rows',map(curr,as_tibble))) %>%
      rename(currency = 1)

    price_estimate_df <- tibble(release_id = release_id,
                                condition = names(result2)) %>%
      bind_cols(res4) %>%
      bind_cols(curr2)
This is the output:
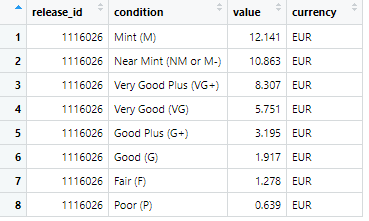
As you can see, this is much easier to work with than the original API output! Now that it’s in this format, it’s possible to use the release_id to join the price suggestions to the information I collected earlier.
Merge and summarize
So now I had information about every release, as well as price suggestions for every release … nice!
However, the release data frame was at the level of one row per release, whereas the price suggestions data frame was at the level of eight rows per release, one for each possible condition. This is a classic example of a ‘one-to-many’ relationship, and I decided that it would be easier to simply choose one condition and use that for summarizing each mix, so I filtered the price suggestions data frame to ‘Very Good Plus’ (aka VG+), which I figured was the median condition of my collection.
Having filtered the data accordingly, it was then super simple to join it to the main data frame:
prices2 <- prices_df %>%
filter(condition == 'Very Good Plus (VG+)')
list_releases_df <- hodderian_discogs_lists %>%
left_join(prices2,by='release_id') %>%
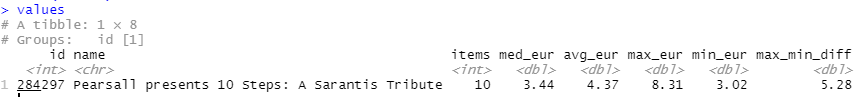
distinct()Since the goal of the project is to compare values on a per mix basis, the next step is to summarize the ‘value’ of each mix using dplyr, where I calculated the mean, median, maximum, and minimum (and difference between max and mix) values for each mix:
values <- list_releases_df %>%
  filter(!is.na(value)) %>%
  group_by(id,name) %>%
  summarize(items = n(),
            med_eur = median(value),
            avg_eur = mean(value),
            max_eur = max(value,na.rm = T),
            min_eur = min(value,na.rm = T),
            max_min_diff = max_eur - min_eur) %>%
  arrange(desc(avg_eur))
Going back to my test example, this is what the output looks like:
And that’s it … I now have the answer to my original question! Pretty cool, huh?
The only thing left to do is to make a nice visualization …
Make some pretty charts
I’m a huge fan of the ggplot2 package; in my opinion it is the single best visualization solution that exists. No other tool can match its range of capabilities. It’s amazing!
I’m not going to walk you through all of the visualizations, but I will touch on the first one I made, which is a histogram of the distribution of mean (average) prices; this is what the code looks like:
value_histogram <- values %>%
  ggplot(aes(x = avg_eur, y = after_stat(density), fill = after_stat(density))) +
  geom_histogram(binwidth = 2, color = "white") +
  scale_fill_gradient(low = "#FF4B00", high = "#FFDD00") +
  labs(title = "Pearsall's Mixes: Distribution of Mean Discogs Suggested Prices", x = "Avg. Value EUR", y = "Frequency")+
  guides(fill='none')+
  theme_clean()
Here’s how it works, line-by-line, to help you better understand:
The x-axis is the average of the Euro values, and I used
after_statto set the fill values to match the density of values (basically meaning that the color gradient should match how many mixes were at a certain price point)I used
geom_histogramto select a histogram as the visualization type and set the bin width and the outline colorI set a fill gradient that went from orange to yellow
I set the image and axis title
I removed the legend
I used
theme_clean from the ggthemes package to set the general look of the chart: font, background, tick marks, etc
And here’s what the output looks like:
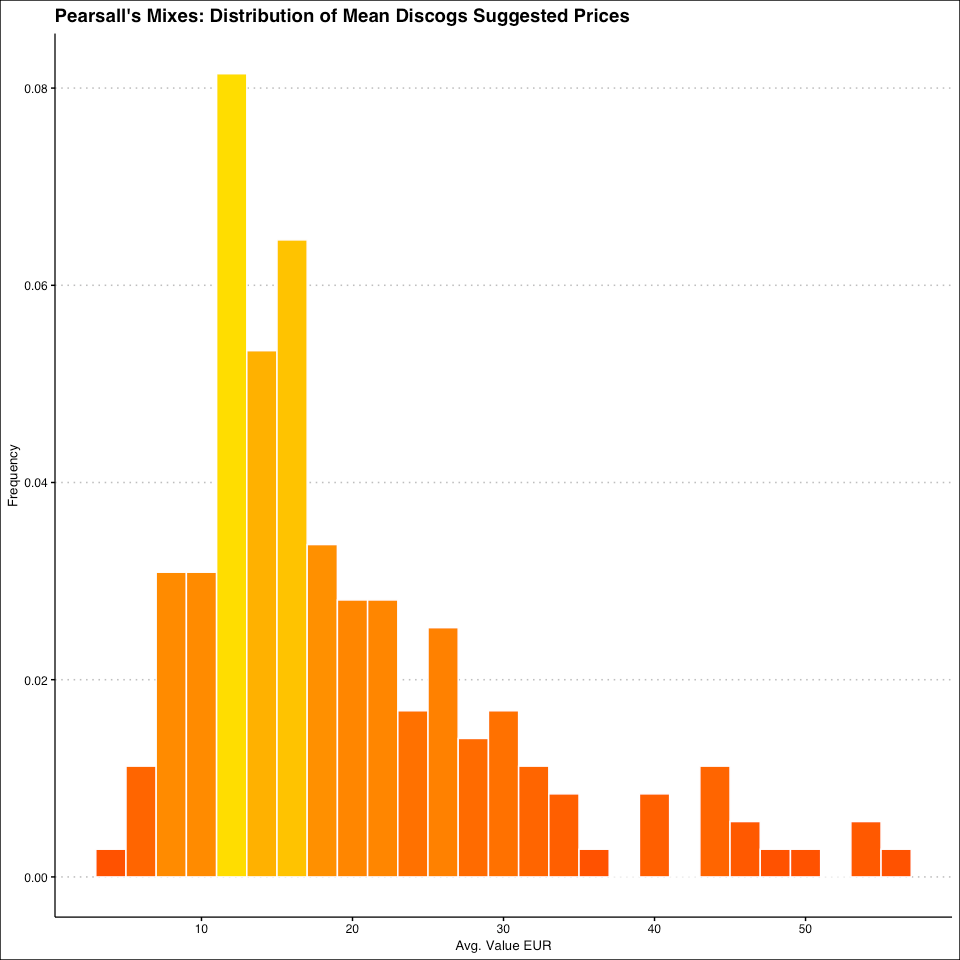
Pretty nice!
One last (music) thing
As I mention in ever newsletter, I’ve been a dj for 26 years, so I (self-indulgently!) sign off every newsletter with a mix. This time, I’m sharing what Discogs thinks is my least valuable mix, a tribute to the Greek dubstep producer Sarantis. I like it! (Even if the records aren’t in high demand)
Thanks for reading!
Hello,
Thanks for sharing this piece of code.
This is a great way to navigate, and get insight about Lists created by user.