
How we built a unified event stream at Snowplow
Creating a single normalized event stream from 9 systems is no joke


Well, I’ve taken a long break since writing my last Substack post! Fortunately there are no paying subscribers to disappoint …
I’ve decided to reactivate this account to tell you about one of the most important, most interesting, and, frankly, coolest projects that I’ve worked on in my first year of running the internal data team at Snowplow: our unified event stream.
Honestly, it’s one of the projects that I’m most proud of in my data career.
What is the unified event stream?
The ‘unified data stream’ is our name for a set of data models that integrate information from multiple different sources into a single normalised event stream at the level of 1 row per 1 event, in order to give us a very comprehensive overview of actions by both our customers and our sales prospects.
Currently the unified event stream contains events from the following sources:
Snowplow Analytics (of course!)
Salesforce
Hubspot
Outreach (our former sales automation system)
Gong (video calls and now sales automation)
Snowflake (for installations of our Snowplow Digital Analytics product)
Stripe (for payments for our BDP Cloud product)
Orbit (for community management)
Zendesk (for customer support tickets)
Creating a system like this is something that many data teams are striving to do, so hopefully this will be helpful to many other data practitioners.
In order to help share my knowledge on this, this post will cover the following topics:
Why we built it
How we built it
How it works
How we use it
Why we built it
Probably the single biggest challenge that confronted me when I joined Snowplow was the extremely disjointed internal data landscape, a legacy of the fact that Snowplow had been a historically decentralised company. Multiple systems, conflicting data, few common standards - trying to understand our customer journeys was really tough.
Something had to be done!
Our first order of business was to set up pipelines from the different business systems into a single Snowflake data warehouse so we could have a single source of truth for business analysis. Although this helped, we still faced the challenge that these different systems landed in the data warehouse with very different table structures, naming conventions, and so on. Doing an analysis that tried to incorporate different data sources was really painstaking and, frankly, painful.
Let’s give an example: let’s say we wanted to trace the sales journey of a prospect where we looked at a combination of stage changes in Salesforce versus email activity (Outreach) and video calls (Gong), as well as web activity (Snowplow). Doing this in a one-off, ad hoc way is very difficult and painstaking - you have decide how to join, what to join, what to define, and it’s difficult to replicate the analysis after the fact, since different analysts tend to approach this problem in different ways.
So our solution was to build a unified event stream: take all of those different data sources, convert them into events in a standardized framework, and use that to understand our customer touchpoints at all points in their Snowplow journey.
What would we be some things we would hope to do with such a system?
Give us clearer insights into how our customers and prospects interact with Snowplow
Understand product usage (and advise the Product team about where to target improvements)
Understand the efficiency of different marketing efforts
Understand better the interplay between our different Go to Market strategies, i.e. marketing, sales, and partnerships
Make it easier to enable our stakeholders to be data-driven by lowering the barrier to entry to working with our different data sets, including by doing self-service in our BI tool of choice, Preset
How we built it
Sounds pretty cool, huh?
But a system like this doesn’t magically appear at the end of a brainstorming session … you have to actually build it!
Our chosen approach was to take advantage of the feature set of dbt, and create a layered model structure.
The general idea is explained in this (simplified) diagram:

Think of it like many streams flowing into a mighty river.
The underlying architecture of the system is based on the following principles:
We ingest data from our different sources via a variety of methods (Stitch, Snowflake data shares, homegrown API connectors, our own Snowplow pipeline)
We process the ingested data in a staging layer inside Snowflake
We build intermediate tables for each data source and event cluster, i.e. Snowplow pageviews or Hubspot emails
Due to the size of the Snowplow atomic events table, we build the Snowplow tables on top of incremental models from our own dbt web package, reducing processing time and compute costs
As the other sources (Salesforce, Gong, Outreach, etc) have fewer events, those are processed in a normal drop-and-replace way
Each data source has its own intermediate table that aggregates all the relevant models using dbt’s union relations function; in this layer we also add extra dimensional information about the event (for example, geo lookup information and traffic sources for web events)
All of the sources are merged in the final business events layer, where we use email address as a key to join with CRM data from Salesforce
In each of these mini-models we normalise the data into a standard event structure with a set of common fields:
event_timestamp- when the event actually happenedevent_id- a unique identifier for each event, usually taken directly from the source systemevent_source- what system we sourced the event fromevent_category- a high-level category for the eventsevent_creator- who made the event; i.e. the user or a Snowplow employeeevent_name- the name of the eventevent_action- a descriptive action name for what the event doesevent_label- a more descriptive label for the event, to make it easier to segment individual eventsuser_email- the unique user email (if we can identify it)app_id- Only for Snowplow web events; tells you on which subdomain the event occurred on
Of course, the final table has many, many more columns (I just checked and we’re at 196 now lol), but the key thing is that every row has values for these common columns.
It’s very important for us to ensure that these values are consistent and coherent, so that for example the event_name and event_label are easily explicable and require little time and effort to understand. This is why we instituted the following naming conventions that we use for any new events that we add into the flow:
Event names should be easy to understand and clear about what has happened
Example:
user_interactionis too vague a name for the final tablebutton_clickormail_openare better - they indicate clearly the action taken
Event names should be structured as
noun_verbas much as possibleAll event names should be in snake_case
We should avoid creating too many unique event names
We should normalize the event names from different systems into this format
We should not include source system in the event name
How it works

Think of this architecture as being a kind of data Lego, where we easily plug in new sources and new events as required. Since there are only a few of us in the Snowplow Data Team, this standardised structure makes it easy to add and subtract events and to troubleshoot problems as they arise.
To add a new data source, we just need to make a new sub-folder in our intermediate folder and format the events into our standard format in one or more mini models, add them into the source intermediate model, and then add that into the main model, where dbt handles the union job with the other sources. It’s easy! Since each of these mini models is quite concise, it’s easy to debug because if you want to fix an errant event_label value, for example, you don’t need to think your way through a huge chain of logic in a single massive CASE WHEN statement. You just find the relevant chunk, play around, test it, open a pull request, merge, and move on.
The main key that we use across our models is email address, because that is most consistently replicated across different systems. In the final merged model we use the email address to join the event stream to data from our Salesforce CRM system, which allows us to enrich the final data set with useful personal and firmographic information. This combination allows us to efficiently group event streams in different ways when doing analysis - for example by company or by industry or by job title or … well, many many many other ways.
How we use it
Building this event stream has offered many benefits to us, principally:
Making it easy to see individual customer journeys
Making it easy to see the sales journey of prospect companies as a whole (by allowing us to roll from the individual level to the company level)
Making it quicker to build reporting and answer ad hoc questions
Allowing us to build data products for different business teams
Let’s walk through each of these in turn.
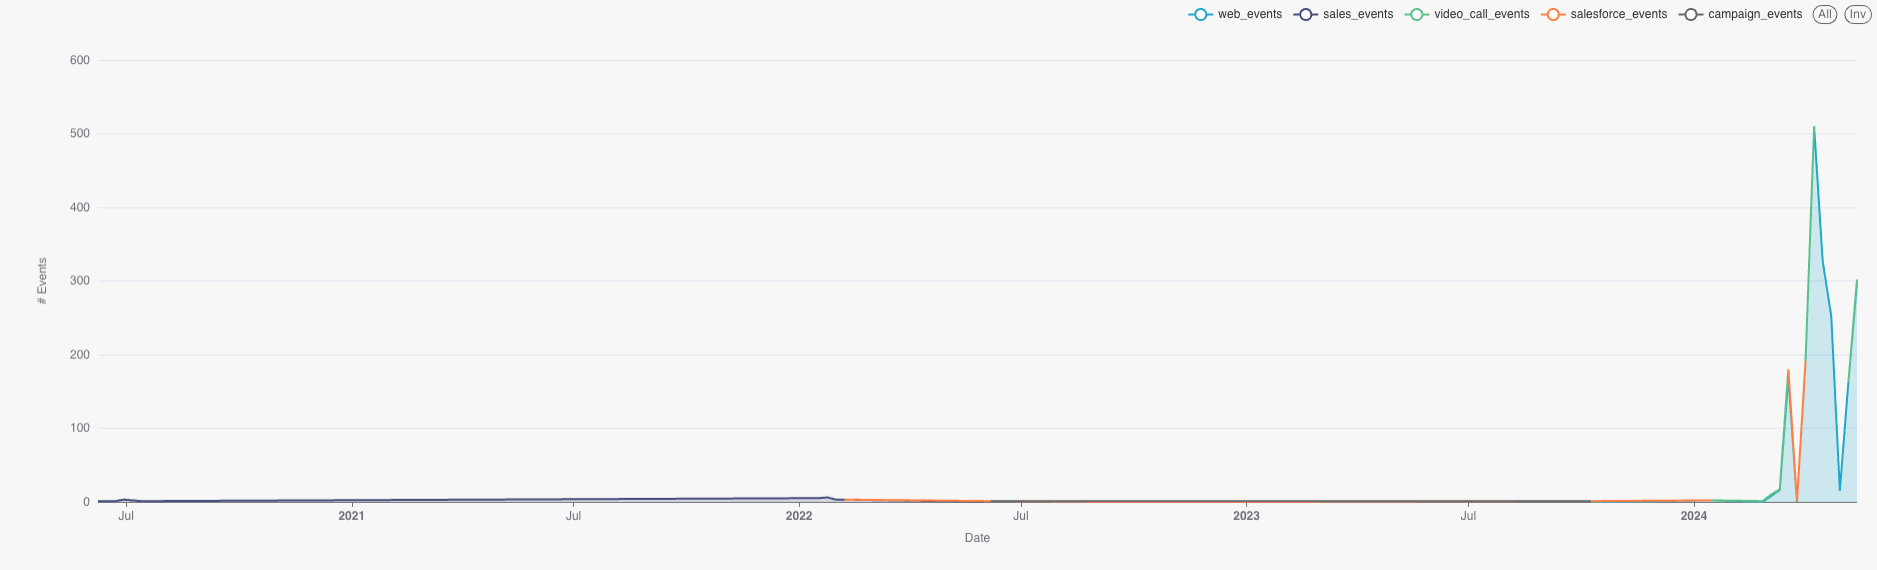
Being able to see individual journeys has been incredibly helpful, because we can see the interplay of different marketing and sales activities with actions on the part of individual prospects, for example here would be an actual example:
Prospect goes through a long period of sales out bounding and marketing emails
The company eventually becomes a customer, so the prospect becomes a user and jumps on a video call (part of the onboarding)
The user sets up an account on the Snowplow Console and starts performing various actions there
After becoming a customer, the user periodically has video calls and email discussions with Snowplow employees
This is just one customer journey, but I’m sure you can see how useful it is to be able to lay it out like this end-to-end, especially because I was able to generate it in seconds with just a simple query, and then quickly visualise it:
The structure of the table makes it very easy for our team as well as our colleagues to answer ad hoc questions and perform exploratory self-service analysis. Let’s take another real world example to show this: in February Snowplow released a new product called Data Apps, and one of our Product Managers wanted to know how many companies were using this feature, how many were using each specific data app (funnel builder and digital analytics), and then if we could pinpoint the companies that had the most number of unique users engaging with Data Apps. Using our unified events table, he was able to build quickly build himself a super useful monitoring dashboard in Preset.
What’s been especially powerful for us has been using the unified events table to build new tools and products for our stakeholders, with the most interesting (in my opinion!) being a system for scoring prospects and automatically managing their funnel stage in Salesforce. This has been hugely helpful, as the company had previously had tons of problems with stage change management via UI-based automation systems in Salesforce and other input systems.
What kinds of problems?
Oh my God, where do I begin?!? Data misalignments, contradictory automations that would repeatedly shuffle prospects between different stages, unreliable one-click integrations, lack of documentation, opaque processes, and difficulties in sustaining accurate contact stages.
By switching to a single code-based system, we’ve been able to quickly troubleshoot issues as they arise, as well as make regular updates and improvements. In the past, if someone would ask why a particular prospect had been automatically moved from MQL (marketing qualified lead) to SAL (sales accepted lead) when they shouldn’t have been, it was often incredibly difficult to figure out what had happened. This is no longer the case - we can now quickly check our logs and get to the ‘why’.
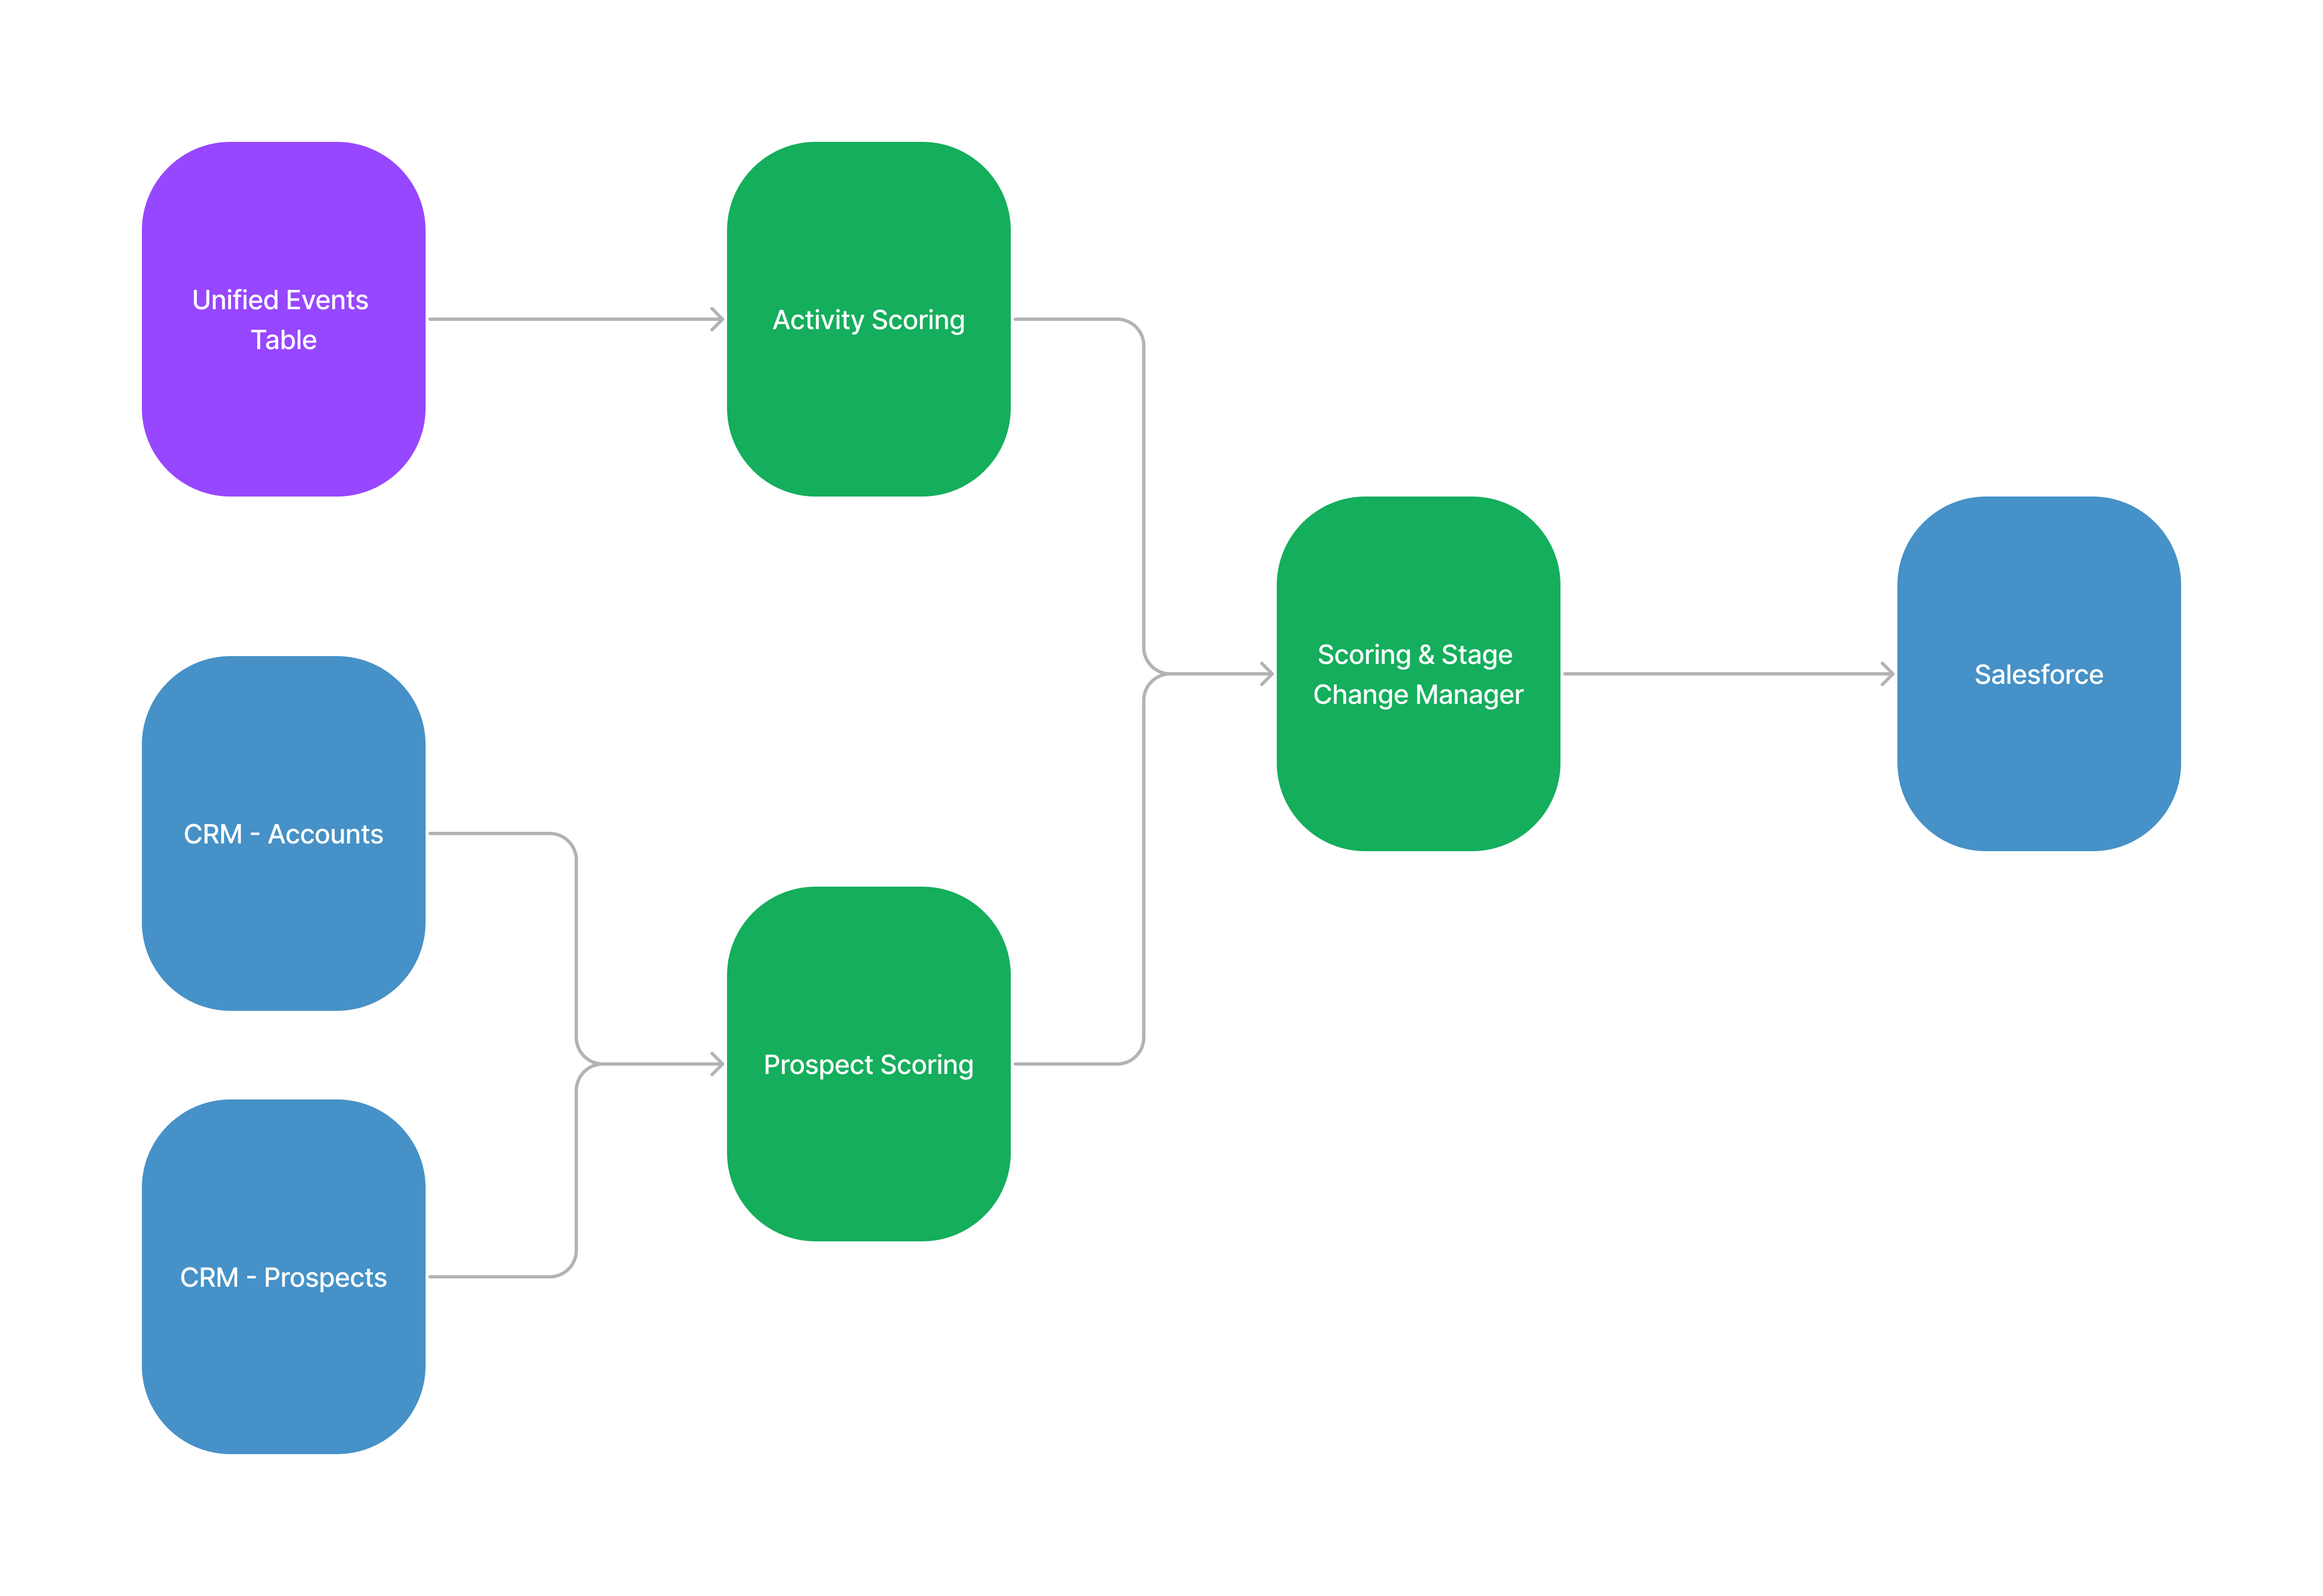
In this new system. we use the event stream to score each unique event and then build a running tally over the previous 90 days - this activity score is combined with a persona score based on personal and company characteristics stored in our CRM system. The activity score is based on the principle that low-value events (individual page views, being added to a mailing list, etc) get a low score, and high-value events (attending a data dinner, requesting a demo) get very high scores, with a sliding scale in between, while the persona score is based around scoring against our ideal customer profile (specific industries, ideal company size, ideal company annual revenue, certain job titles and function, etc).
Taken together they produce an overall score that is recomputed on each run and can be used to move prospects to MQL as well as to provide our reps with an important signal about prospect quality. Similarly, we use other signals from the event stream to make decisions about moving prospects between other stages, and we then run a pipeline job after each model run to update Salesforce by updating the prospect scores as well as changing the funnel stage as required.
This is a simplified diagram that gives you an idea of how the system works:
Overall, this has been a really exciting project to work on, and as you can see it’s been something that has been really useful. If you have any questions about this project, feel free to hit me up, or if you’re interested in Snowplow, feel free to make a demo request here.
One last (music) thing
Every post ends with a dj mix from my massive back catalogue, and for this one I’d like to share a personal favorite from last year, my tribute to Bristol-based producer Om Unit. I recorded this mix in literally our last night in our old flat in Wilmersdorf before we moved out after ten years - it seemed like a nice bit of synchronicity to record this specific tribute as a final farewell to our home of so many years.
Om Unit (aka Jim Coles to his mom) has been probably my favorite electronic music producer of the last ten years. I love how he integrates his distinctively synth-heavy, melodic, bass-forward sound into all kinds of musical frameworks. He's done everything from 110 bpm (and slower) dub / downtempo beats to 140 bpm breaks and dubstep and then all the way up to 160 bpm footwork and 170 bpm jungle and drum n' bass. What's really cool about his work is that even though he works at different tempos and in quote-unquote different genres, his music always sounds like him. In this day and age, it's hard to find artists with a clear and distinctive sound, and he really has that. I love that he doesn't compromise his musical vision, that he bends the genres to his sound, instead of the other way around.
Enjoy, and thanks for reading!
This was an excellent read and love that it ends with a track you made – sounds good! 🥁